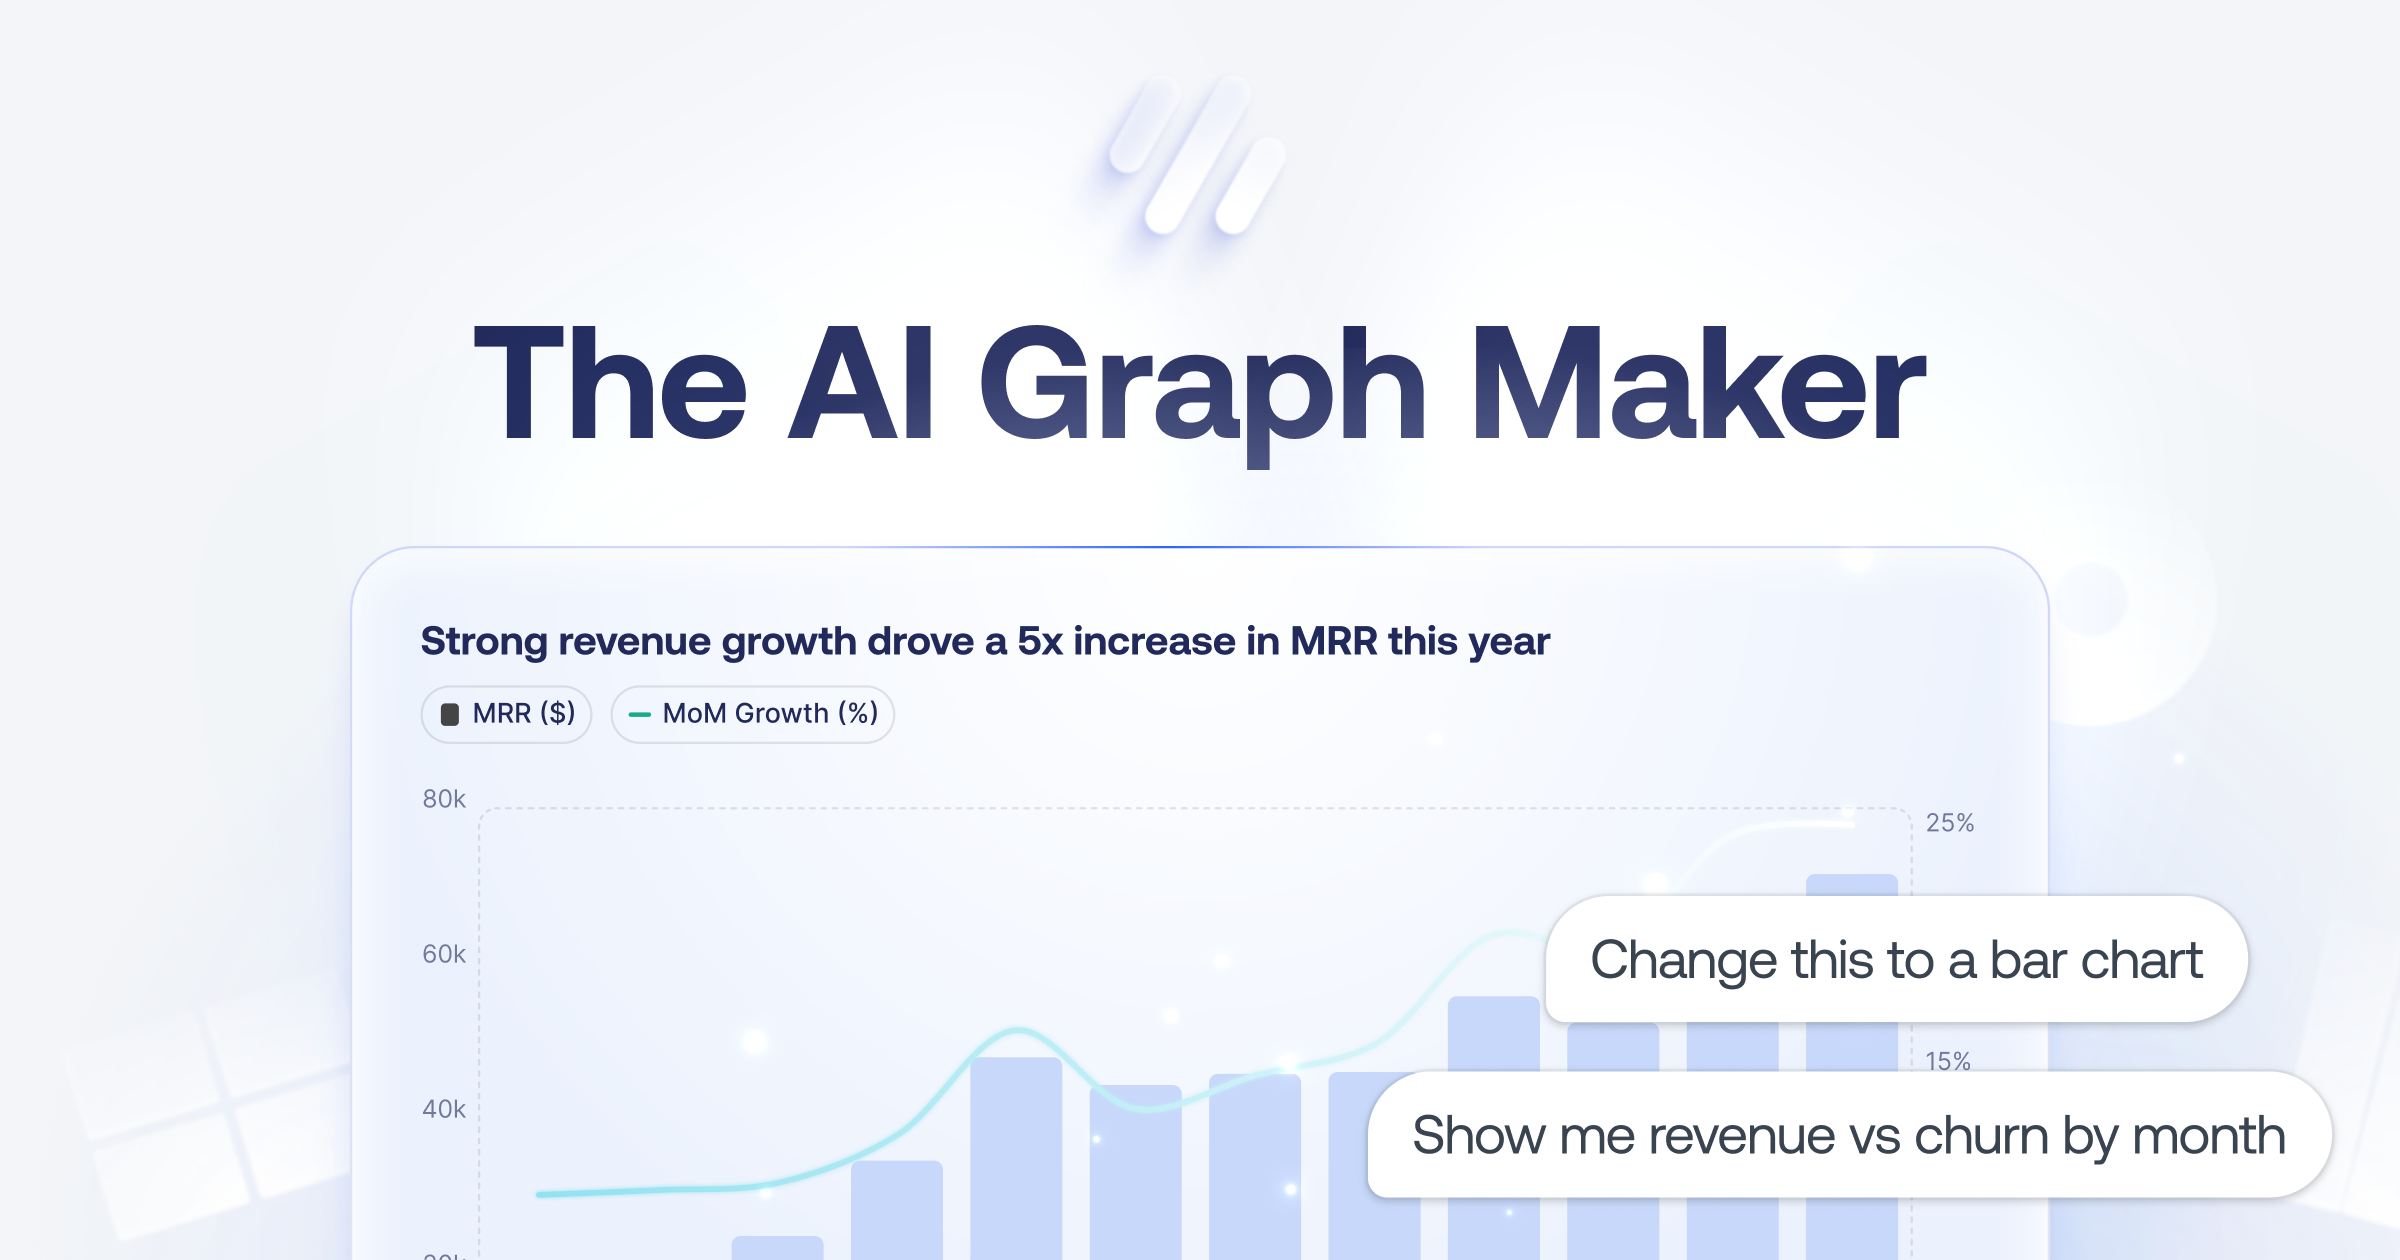
Graphy
Graphy is an AI-powered visualization platform built for professionals who need to transform raw datasets into presentation-ready charts without the manual labor of traditional spreadsheet tools. The software bypasses the …
About Graphy
Graphy is an AI-powered visualization platform built for professionals who need to transform raw datasets into presentation-ready charts without the manual labor of traditional spreadsheet tools. The software bypasses the …
Use Cases
Real-world scenarios where Graphy saves time.
Use Case 1: Professional Board Presentations
Problem: Financial analysts spend days formatting spreadsheets into aesthetic charts for executive meetings.
Solution: Graphy imports data and uses an AI engine to highlight key insights and apply brand-consistent designs.
Example: A CFO links a live Google Sheet and generates a set of executive-ready slides in one click.
Use Case 2: Social Media Data Content
Problem: Sharing raw data on social platforms is rarely engaging because generic spreadsheet charts look unprofessional.
Solution: The platform creates high-performing visual content optimized for social feeds with custom colors and fonts.
Example: A marketer creates a viral line graph comparing industry growth trends with their brand's specific styling.
Use Case 3: Live Internal Reporting
Problem: Sending teammates to complex BI dashboards often leads to confusion or low adoption.
Solution: Users can embed live, annotated charts directly into company documents or Slack updates.
Example: A product lead embeds a daily active user chart into a project doc that updates automatically every morning.
Key Features
What you get out of the box.
- Direct Google Sheets and API connectivity
- AI-powered data trend highlighting
- Instant branding with custom colors and fonts
- Conversational 'Chat with Data' interface
- Multi-platform embedding (Docs, Slides, Social)
- Support for CSV and Excel file uploads
- Aesthetic chart templates (Bar, Donut, Line)
- Real-time data synchronization for embeds
Reviews (0)
No reviews yet. Be the first to share your experience!
Related Tags
Similar tools you might like
More tools from the Developer Tools category.
 Developer Tools
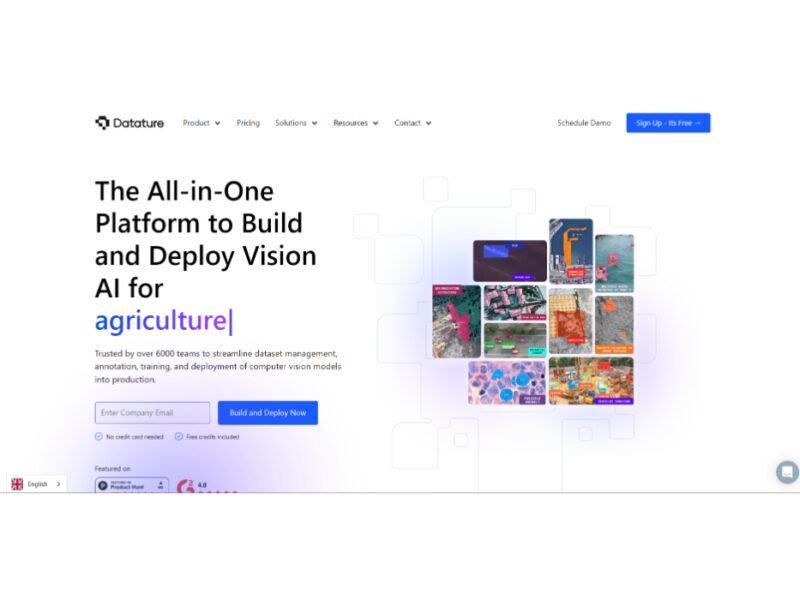
Datature
Datature is a cutting-edge AI vision platform tailored for the seamless development of computer vision …
 Developer Tools
ReliableGPT
ReliableGPT is a robust and innovative tool designed to enhance the stability and reliability of …
 Developer Tools
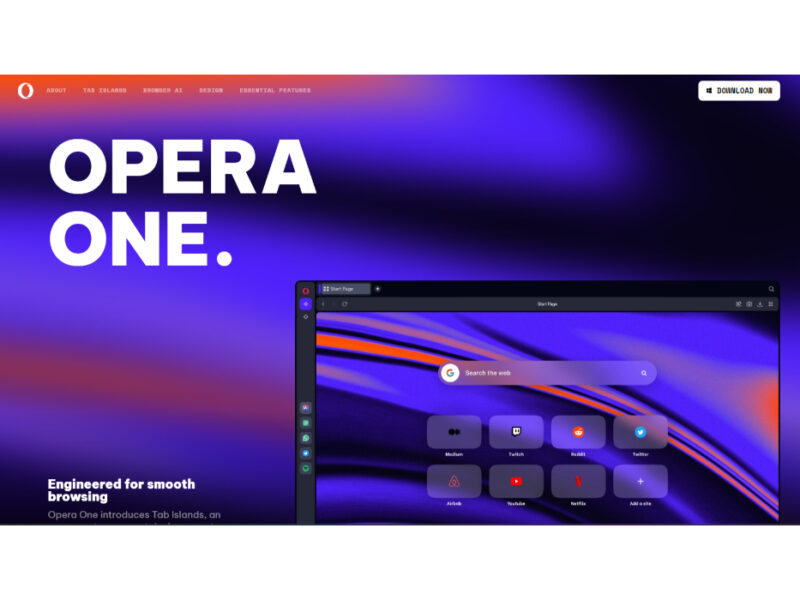
Opera One Browser
Opera One is a next-generation browser that emphasizes a liquid navigation experience. It stands out …
 Spreadsheets
SheetGod
Unlock productivity and efficiency with our expert Excel formula optimization and automation services. Simplify complex …
 Developer Tools
GPTsuite
Get access to our exciting and powerful generative AI tools on a simple and flexible …
 Developer Tools
MindStudio
MindStudio by YouAi is an innovative platform that enables users to create personalized AI applications …
Are you the owner of Graphy?
Claim this profile to update info, add features, and respond to reviews. Verified badges are free.
Login to claim